I use Compiler Explorer (aka. Godbolt) quite a lot.
I also spend some of my free-time writing kernels for GPUs. Although Godbolt has some CUDA C++ support (you can compile a kernel, see the PTX and SASS), GPU programming today has much more than just CUDA C++ & NVIDIA.
There is HIP for AMD, DSLs like Triton, Mojo, and TileLang, embedded DSLs like CuTe, CuTile, CUTLASS, ThunderKittens, and HipKittens, and multiple compilation targets across vendors.
I would like a tool where I can write my kernel in any language or framework, and see interactively the compiled IR and assembly. This is useful for performance optimisation work, or intuition for how the different languages compile down into machine instructions.
GPU Explorer is an attempt to build this.
Compilation Layers
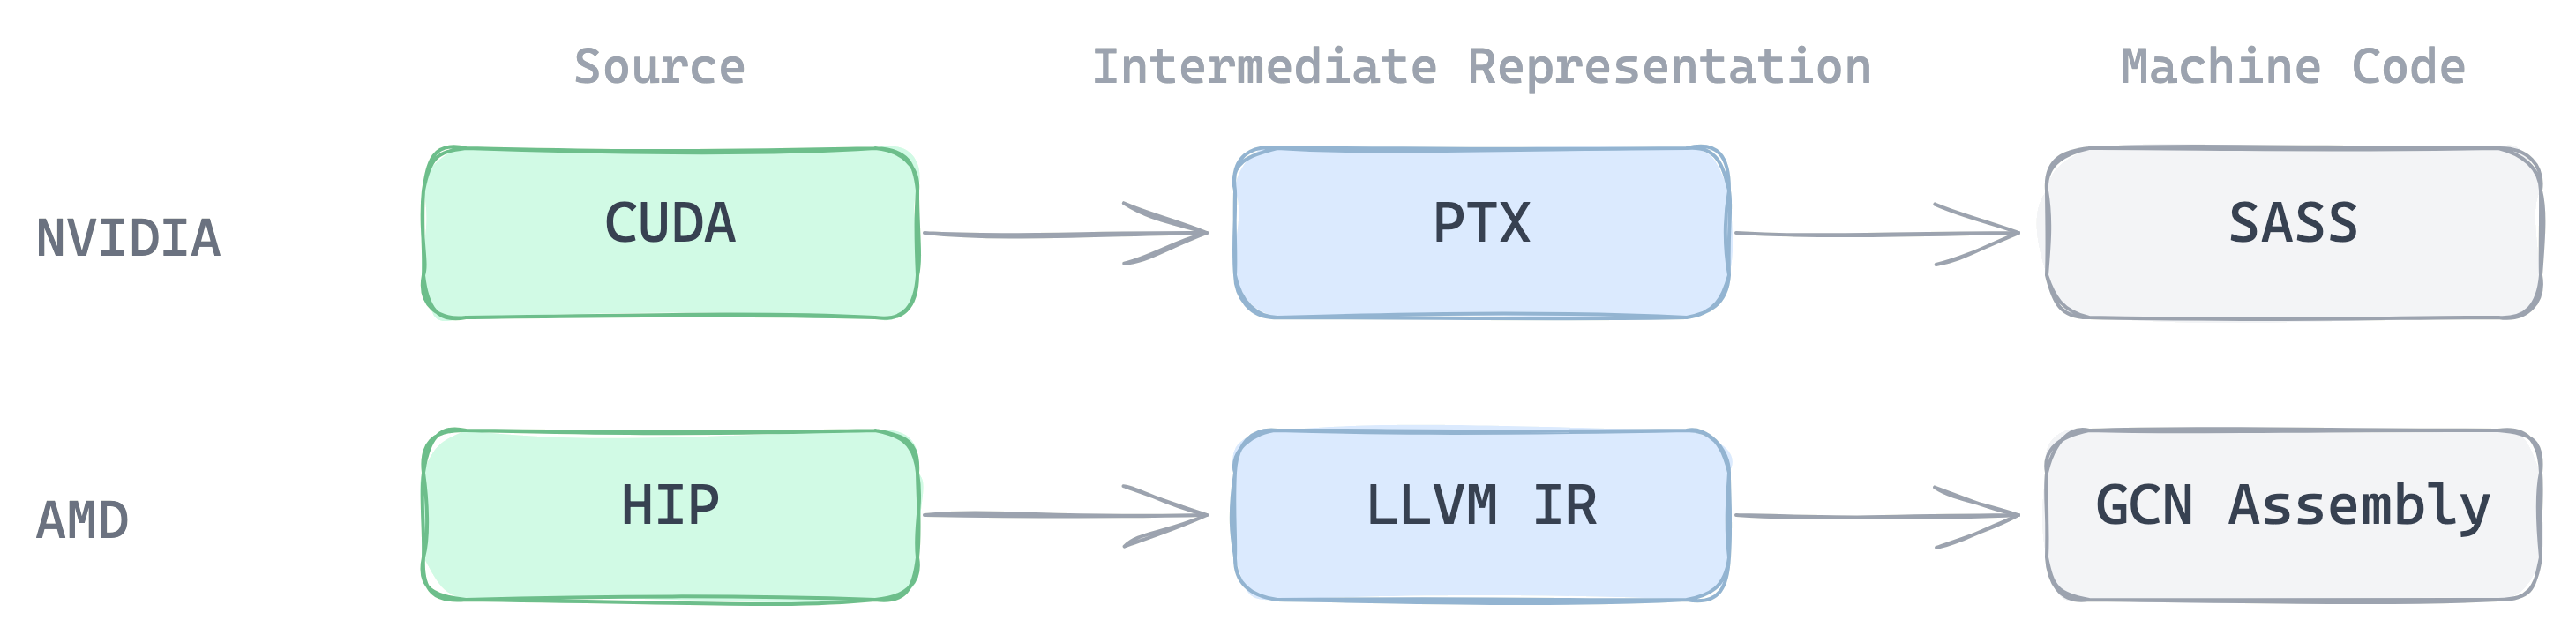
CUDA compiles in two stages. First to PTX, NVIDIA's virtual ISA, portable across GPU architectures. Then to SASS, the actual machine instructions for a specific GPU.
PTX is readable and maps closely to your source. It is where you verify that the compiler understood your intent: did it emit cp.async or fall back to a regular load? Did it vectorise to ld.global.v4.f32 or generate scalar loads? PTX is also the level at which you write inline assembly to access hardware features not exposed by CUDA C++, like ldmatrix, mma, or wgmma. You need to see what the compiler generates at this level to know what to override.
But PTX is not what the GPU executes. The PTX-to-SASS lowering decides register allocation, instruction scheduling, and instruction selection. A kernel that looks clean in PTX can spill registers to local memory at the SASS level and destroy occupancy. Whether the compiler software-pipelined your inner loop, how it handled warp divergence, whether it dual-issued across functional units - these are only visible in SASS. You cannot reason fully about performance without seeing the actual machine code.
For AMD, this IR/ASM separation is less obvious. There is no designed portable IR like PTX. HIP compiles through Clang/LLVM, so the intermediate representation is LLVM IR, a general-purpose compiler IR rather than a GPU-specific one. The final output is GCN/RDNA assembly. GPU Explorer shows both, but it took some work to extract useful output from the AMD toolchain.
Line Mapping
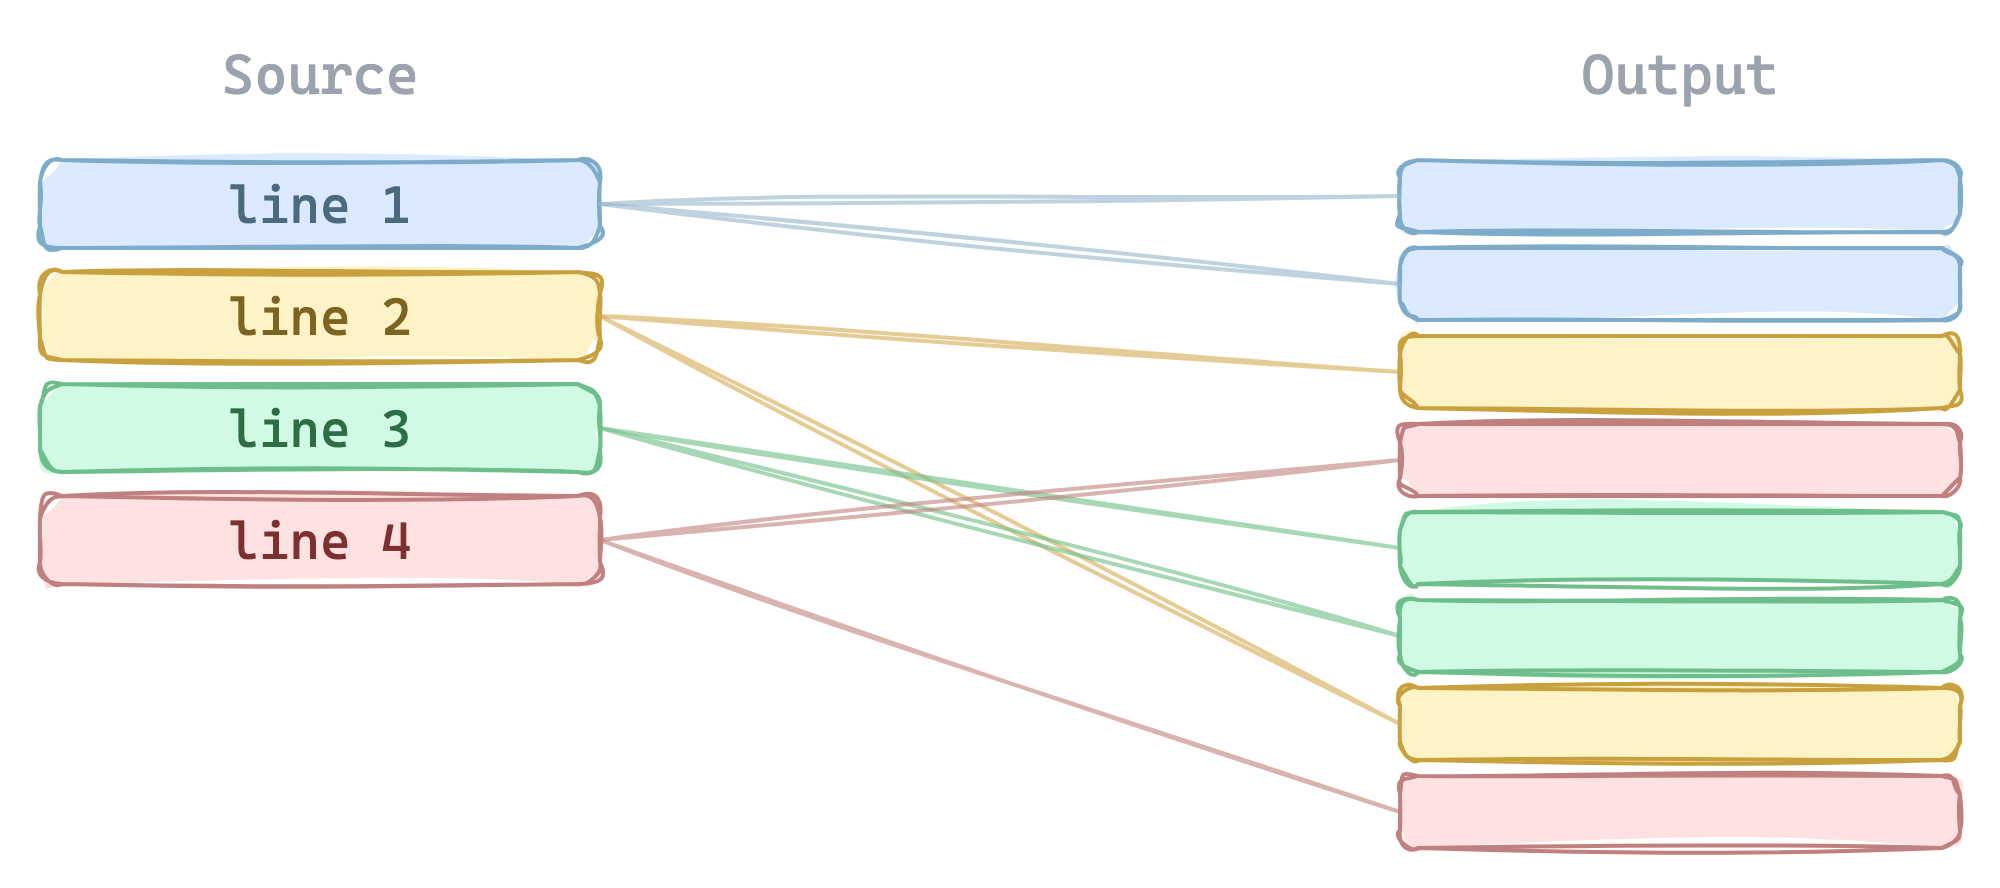
The harder part is line mapping, showing which output instructions came from which source line.
GPU compilers emit debug information that encodes source locations, but it is not designed for interactive use. The compiler interleaves instructions from different source lines due to scheduling. Function preambles correspond to no source line at all. SASS line information is keyed by instruction address, not position, and has to be correlated from a separate tool. Each platform & representation uses a different debug format.
GPU Explorer parses all of these and produces a unified source-to-output mapping.
Interface
The interface is three panes: source on the left, IR in the middle, assembly on the right.
Hover over a line in any pane and the corresponding lines in the other two light up. Hover over an instruction in the PTX or SASS output and a popup shows its definition from the documentation. Write __syncthreads() and see the bar.sync it becomes. Switch from Ampere to Hopper and watch new instructions appear. Toggle between -O0 and -O3 and see the compiler eliminate loads, unroll loops, reorder memory access.
Multi-Platform
GPU Explorer currently supports NVIDIA (CUDA to PTX + SASS), AMD (HIP to LLVM IR + GCN assembly), Triton (Python to PTX/LLVM IR via JIT), and ThunderKittens.
The same example kernels (vector addition, tiled matrix multiplication, warp reductions, bank-conflict-free transpose) are available in each language, so you can see how the same algorithm compiles across different paradigms & hardware.
Infrastructure
Generating PTX & SASS does not require a GPU. nvcc compiles to PTX, then to a cubin, and cuobjdump extracts the SASS disassembly. The whole pipeline runs on a CPU. Same for AMD, hipcc generates LLVM IR & assembly without a physical GPU present.
The backend runs these toolchains inside Docker containers with the CUDA & ROCm toolkits installed. Each compilation is sandboxed: no network access, capped memory & CPU, hard timeouts. If a local nvcc or hipcc is available it uses that instead (faster, no container overhead). The frontend detects which compilers are available at startup.
Results are cached by a hash of the source code & compiler options. Once you have compiled a kernel at -O3, switching back to it is instant. Compilation triggers on every keystroke (debounced), and returns in under a second for local toolchains. The goal is for the tool to feel quick & interactive.
Note: as this is a personal project, gpuexplorer.com is currently hosted on a free Render instance. Compilation there is noticeably slower than running locally.
Building Intuition
For me, the value is here building intuition. Seeing the cost of an abstraction. Seeing whether shared memory loads & barriers ended up where I expected. Seeing what a warp shuffle compiles to. Seeing where NVIDIA & AMD diverge on the same HIP kernel.
These are questions that are hard to answer by reading documentation, and easy to answer by looking at the compiler output, if the tooling is fast enough to be part of your workflow.